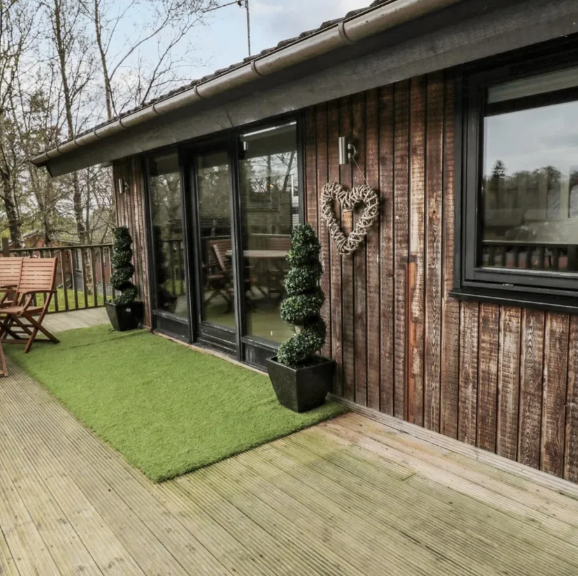
The property was listed for £130,000 and had previously been a holiday let. The listing quality and pricing strategy suggested poor management — creating an opportunity to acquire a failing holiday let and turn it into a high-yielding asset.
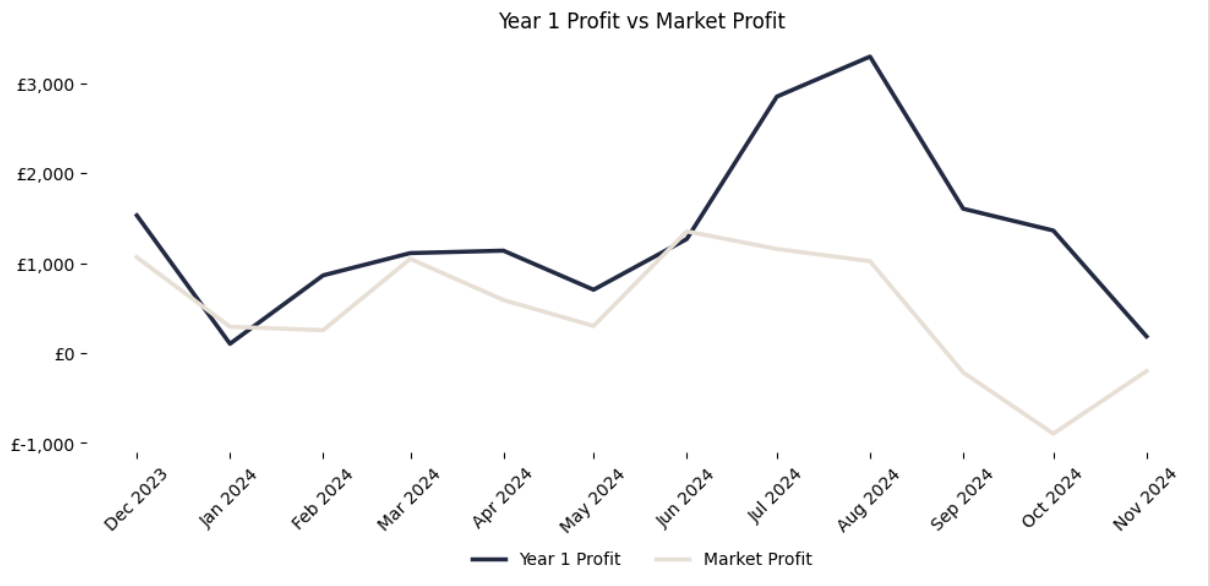
The market was strong with proven numbers predicting £55,000 revenue per year. After negotiations, we acquired the property for £121,000.
The property came fully furnished, included in the negotiated purchase price along with a hot tub and sauna. The cost of listing and professional photography was covered by us for our investor. After auction fees and legal costs, the total investment came to £130,000. In December 2023, the property was ready.